31 Dec 2021 (Fri)
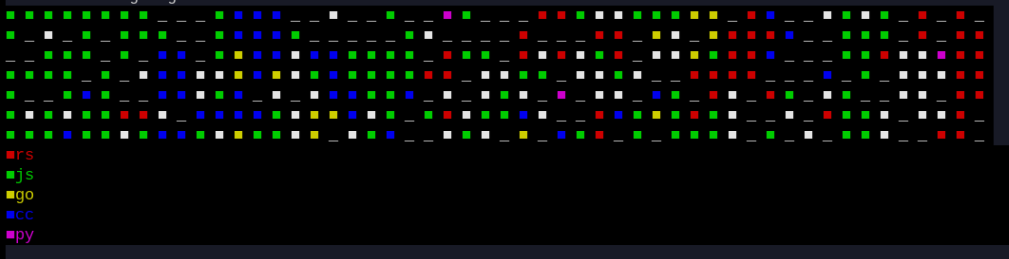
20:50:01 # Life Plot something like github graph from my local repos. Github is nice but only shows what I have published on github. I wanted to see how much activiity I had from my coding. My personal repositories have more commits in 2021 than 2019, or 2020. 2019 activities were mostly C++. 2020 activities were mostly on golang and js. 2021 activities showing signs of rust.