29 Apr 2023 (Sat)
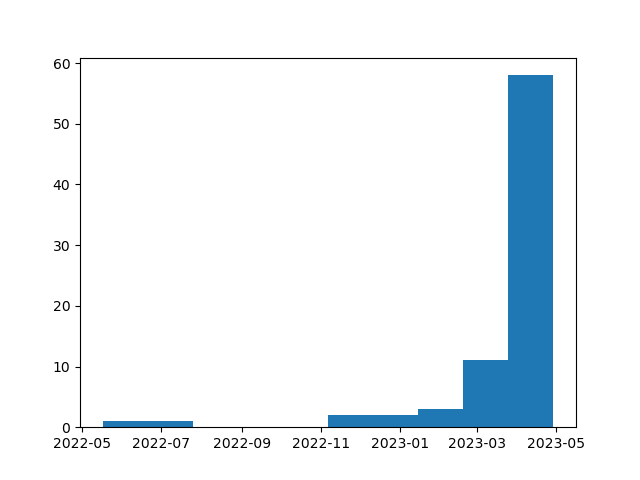
11:37:23 # Life Draw graph of number of commits. I thought I had lots of commits this month for Chrome OS. To count those, all merged commits have committer Chromeos LUCI. To get the timestamp of the commits, git log --committer="Chromeos LUCI" --pretty=%ct . gives me the list of timestamps. UNIX timestamp can be parsed with datetime.fromtimestamp, and then that array can be processed with density graph plot or histogram plotting tool, such as plt.hist.
r = subprocess.run(["git", "log", "--pretty=%ct", "--committer=Chromeos LUCI",
                    "."],
                   capture_output=True, check=True, encoding="utf-8", cwd=p)

data = [datetime.datetime.fromtimestamp(int(a)) for a in r.stdout.split()]

fig = plt.figure()
plt.hist(data)
fig.savefig("out/commits.histogram.png")